The HYPATIA simplified event page
To the students and teachers
The simplified version has been merged with the full version. According to your needs you can configure HYPATIA to have the windows and options that you require. This is done through the configuration file hypatia.ini which is found in the configuration folder of the application. To get the simplified version make the following changes to hypatia.ini:
HideInvariantMassWindow = 1
DemoMode = 0
SimplifiedControlPanel = 1
HideSimulated = 1
You are of course allowed to use any combination of the above switches to configure HYPATIA according to your needs.
There are three different windows which provide all the information needed for :
The “Canvas Window" where you see a graphical representation of either the front–view or the end-view of the detector surrounding the collision point or a combination of both. As already discussed in the "Basics" page, the produced particles interact with different parts of the detector shown in different colours and leave traces which are shown as lines called tracks. In order to learn more about these tracks you have to go to the "Track Momenta Window", which shows the characteristics quantities of the selected tracks. The “Control Window” is auxiliary and enables you to better control the “Canvas Window” .The different functions of each window are briefly explained below.
The event file which contains the events to be displayed in the canvas window and studied can be chosen from the “File” tab in the “Track Momenta” window . The event control is given by the “Next Event”, “Previous Event” tabs of the “Track Momenta” window.
| Canvas window |
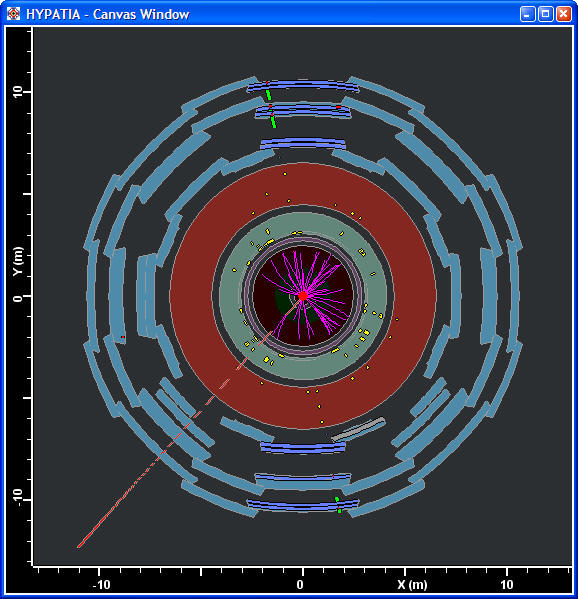
The main event display (ATLANTIS). The detector components are drawn as circles and each event is individually shown. The tracks belonging to the event as well as the detector components are displayed. There are two views available (controllable through the “control window”).
The end view which is the projection perpendicular to the direction of the colliding protons. In this projection the initial energy and momentum is zero, so any net momentum indicates missing transverse momentum/energy (Etmiss). It is represented in this view with a dashed line which shows the direction of the missing transverse momentum. The value of the Etmiss is displayed in the header of the “Track momenta” window. In this view only the barrel part of the ATLAS detector is visible. Therefore tracks which go in the forward direction appear as not being registered by some outer parts of the detector.
|
 |
| |
|
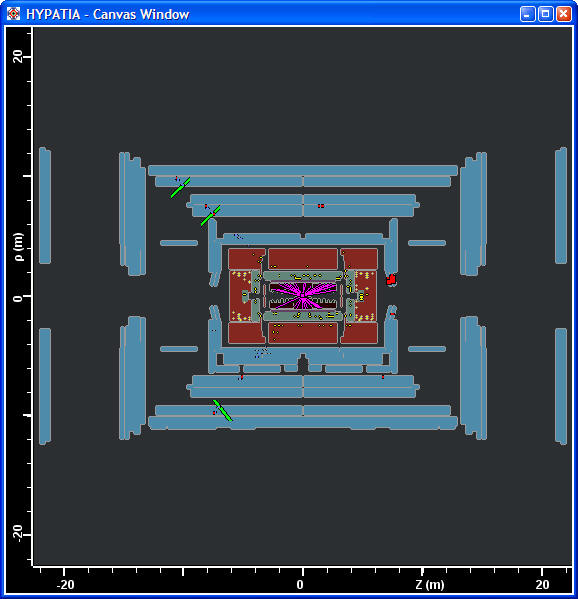
The other view is the side view, the projection along the direction of the colliding beams. All parts of the ATLAS detector (barrel and end-caps) are visible in this view as well as all tracks registered. The line at ρ=0 cm is the place where the protons circulate, therefore there are no detectors close to this line since they would suffer from the radiation environment.
|
 |
| |
|
| Control Window |
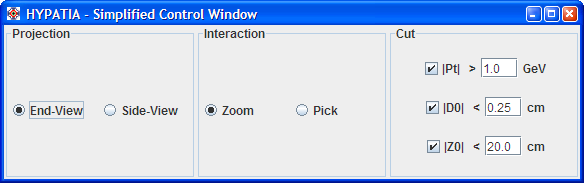
The Control Window is used to view and modify parameters that control the event display on the Canvas Window. There is the possibility to select an individual a track on the Canvas by clicking the “pick” button. The track becomes highlighted and its parameters (momentum, charge, angles) will be shown highlighted on the “Track Momenta” window. The “cut” button gives the possibility to display (in both windows) only the tacks which have a transverse momentum (component of the momentum on the plane perpendicular to the beam axes) greater than the cut value. Spacial cuts (D0 and Z0) are also provided. This helps to clean up the display a bit. |
 |
| |
|
| Track Momenta Window |
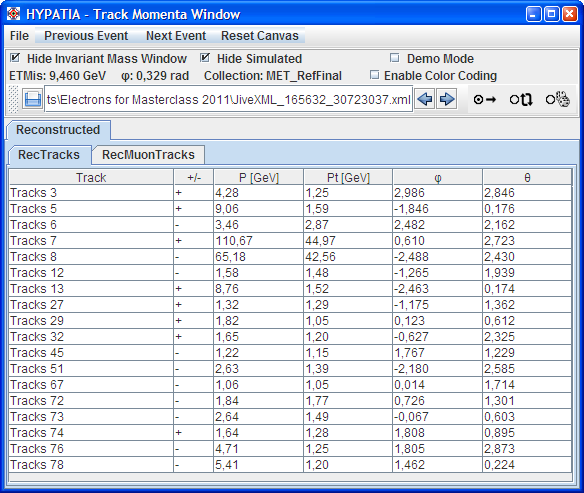
Displays the quantities which describe each track and it has to be used for further analysis. The columns from left to the right show the track kind, its momentum, its charge, its transverse momentum and the φ, θ angles (z being the direction of the beams and the x, y axes are defined in pictures above of the “Canvas Window”). The default version shows only the tracks reconstructed by the Tracker (RecTracks tab) The simulated as well as the tracks reconstructed in the Muon Spectrometer (RecMuonTracks) can be displayed by unchecking "Hide Simulated". However, this tab should only be used together with the supervisors..
The simulated tracks are generated tracks before reconstruction, namely before interaction with the detector, therefore the particle type is known and displayed. This info can be hidden by clicking the “Hide Simulated” tab on the header. The header shows the event number and the Etmiss of the event, as well.
|
 |
| |
|
|